Your Blood Pressure by Age: The No-Nonsense Guide to What’s *Actually* Normal
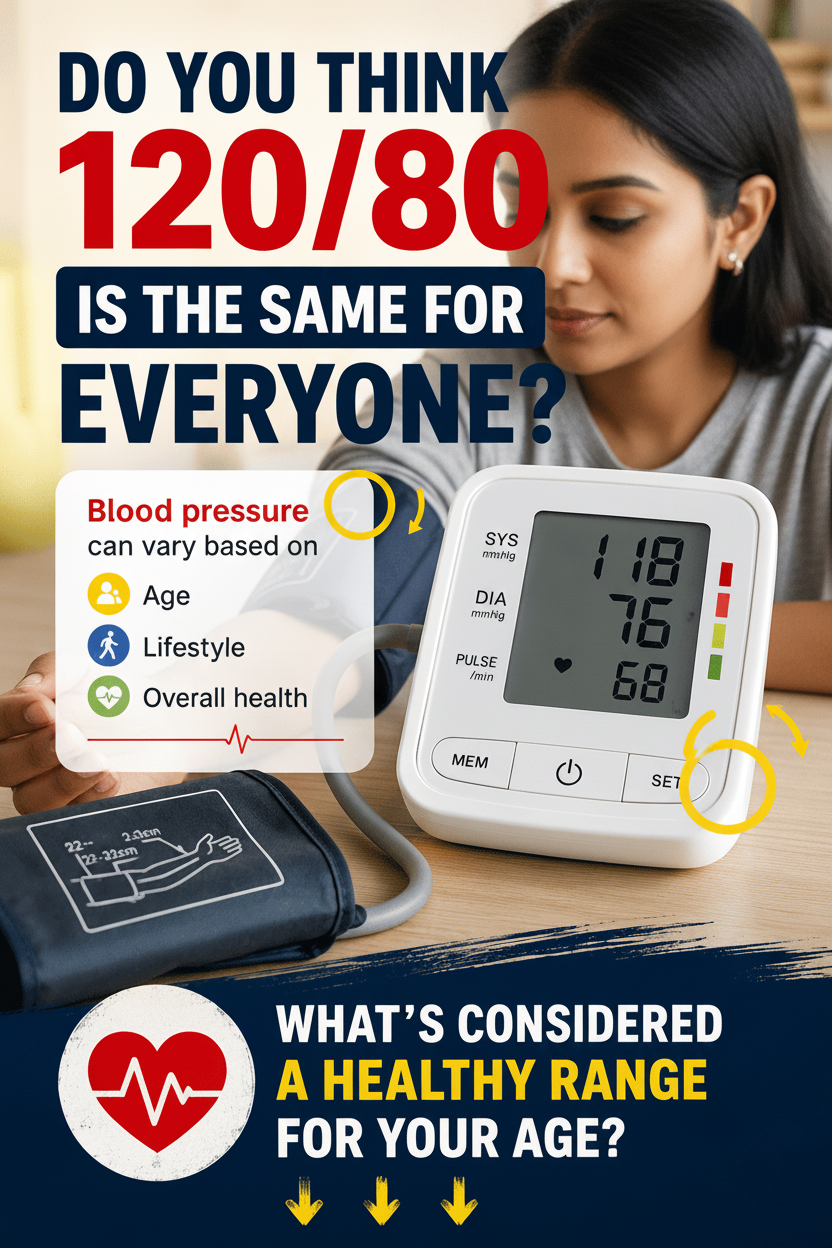
Let’s be real: you probably eyeball your blood pressure monitor, instantly thinking, “Is this 120 over 80, or am I in trouble?” And when those digits flash something like 138 over 75, especially if you’re hitting your 40s, 50s, or beyond and life’s a full-throttle race, a little panic might set in. Guess what? That gut feeling? Totally valid. Your blood pressure isn’t a static number; it moves and grooves with you through life. What’s “normal” can feel like a moving target! But here’s the hook: forget the guesswork. We’ve got the latest, no-fluff guidelines from the pros to cut through the noise. Stick with us, and by the time you’re done, you’ll know exactly what your numbers mean at *any* age, plus killer daily tips to keep those levels dialed in, no matter where you’re at.
Your Blood Pressure Numbers: What Are They *Really* Telling You?
Alright, let’s break it down. Your blood pressure isn’t just one number; it’s a dynamic duo, measured in millimeters of mercury (mmHg). The first number, the big one on top, is your systolic pressure – that’s the raw power in your arteries when your heart *beats* and pumps blood like a boss. The second number, the one at the bottom, is your diastolic pressure – that’s the chill-out pressure when your heart *rests* between beats. Together, these two tell you the real story of your heart and blood vessels, how they’re hustling all day long. One reading? Just a glimpse. But tracking them over time? That’s where the magic happens, giving you the real intel. And trust us, once you get these basics, you’ll feel a whole lot more in control.
The Cold, Hard Facts: Adult Blood Pressure Categories You NEED to Know
Listen up! The American Heart Association, the big guns in heart health, says these categories for adults are set in stone – no matter if you’re 20 or 80. Here’s the straight-up breakdown the pros are using right now:
| Blood Pressure Category | Systolic (top number) | and/or | Diastolic (bottom number) |
|---|---|---|---|
| Normal | Less than 120 | and | Less than 80 |
| Elevated | 120–129 | and | Less than 80 |
| Stage 1 Hypertension | 130–139 | or | 80–89 |
| Stage 2 Hypertension | 140 or higher | or | 90 or higher |
These categories are your compass, helping everyone, from fresh-faced young adults to seasoned seniors, pinpoint exactly where their numbers land. But here’s the twist that often catches people off guard: while these official categories don’t budge, your *average* readings? They definitely start to creep up as the years roll by. Don’t let that freak you out just yet – understanding is power!
Age Ain’t Just a Number: How Your “Normal” Blood Pressure Evolves
So, we know the target ranges are fixed. But let’s be honest, the numbers you actually see on that monitor tend to climb a little bit with each passing decade. Data and research back this up, showing these general trends. Still, the ultimate goal? Keep those numbers in the normal zone for long-term health and a life lived to the fullest. It’s about playing the long game.
Kids and Teens: Not Just Mini-Adults When It Comes to BP
When it comes to the little ones and teenagers, doctors don’t just slap a single number on them. Nope. They use fancy growth charts and percentiles, taking into account age, sex, and height. It’s a custom fit, not a one-size-fits-all deal. But generally, here’s what they often see:
- Infants and toddlers: often around 80–110 systolic and 50–70 diastolic
- School age children: approximately 95–112 systolic and 57–71 diastolic
- Adolescents: closer to 112–128 systolic and 66–80 diastolic
Your pediatrician uses these tools like a secret weapon during those regular check-ups, making sure everything’s on point for healthy growth and development. They’re the pros, so trust the process!
Young Adults (18–39): The Prime Time for Peak BP
This is often the sweet spot, where averages are at their lowest. For the ladies, we’re talking readings frequently around 110 over 68. Gents, you’re usually closer to 119 over 70. For most folks in their 20s and 30s, keeping things in the normal range is a breeze with solid daily habits. You’re basically crushing it without even trying too hard.
Middle-Aged Adults (40–59): The Climb Begins – Stay Vigilant!
Alright, listen up, 40s and 50s crew! This is where those averages start to creep up a bit. Women might see around 122 over 74, while men could be closer to 124 over 77. Good news? For most, this is still totally manageable and within striking distance of the normal zone. But